In 2013, I started monitoring my mental health. I scored my day based on my subjective impression on a scale from one to ten. I had a vague sense that a day less than five had more pain than pleasure, and vice versa for a day greater than five. But the reason I'd rate some days a seven was because the day 'felt like a seven'.
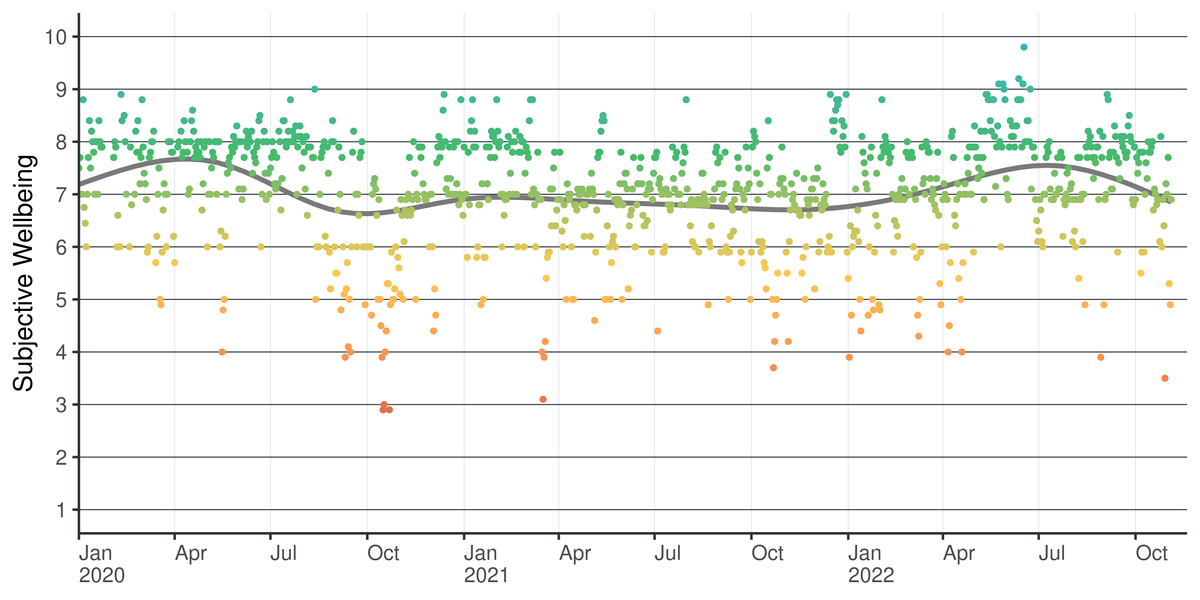
Here's how it looked for the past three years.

The bulk of this time was enduring the Covid pandemic, so there was a lot of languishing. Things were pretty tough in Oct 2020. Then 2021 was pretty meh. But 2022 has picked up.
The ONS Wellbeing scale
In 2020, I started using ONS Well-being Scale in my evening journal. These are four empirically validated measures of wellbeing:
- Overall how satisfied are you with your life? (1-10)
- To what extend are the things in your life worth doing? (1-10)
- Overall how happy were you today? (1-10)
- Overall how anxious did you feel today? (1-10)
The ONS is a more nuanced measure than my ten-point subjective wellbeing scale. However, for simplicity I add the four ONS scores together (reverse scoring Q4 because it's negative) to create a single composite index. The composite score over time is plotted below.
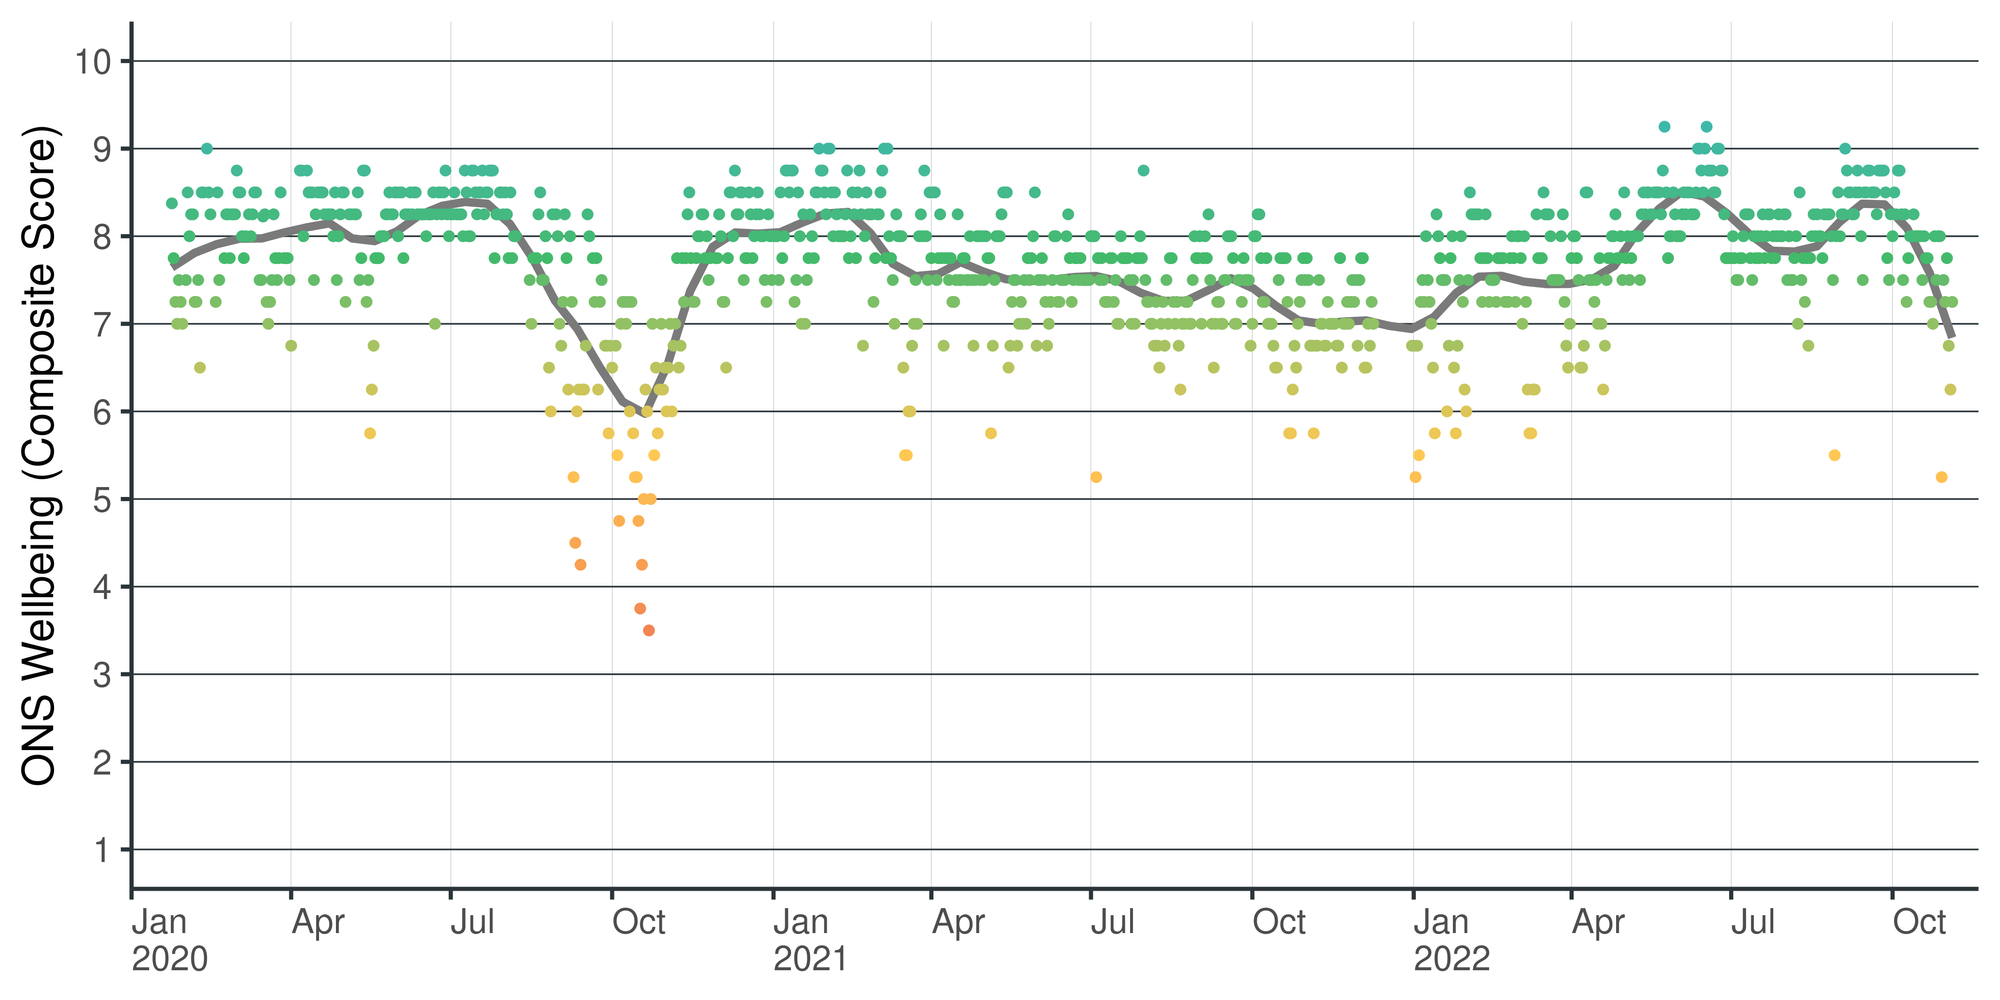
The ONS questions are closely correlated with my empirically unsound subjective wellbeing. Where my subjective wellbeing dipped, the ONS dipped too. When they rose they often rose together. This isn't surprising as they're measuring the same thing. But the ONS is more structured and teases out unique components of wellbeing above and beyond my mood that day.
We can see how closely correlated the measures are by regressing the ONS scores against my subjective wellbeing scores. The correlation isn't perfect because I respond to the ONS using whole numbers (1, 2, 3, etc.) but rate my subjective wellbeing up to one decimal place (1.1, 1.2, 1.3, etc.). However, when we average the ONS questions, the average has at least one decimal place.
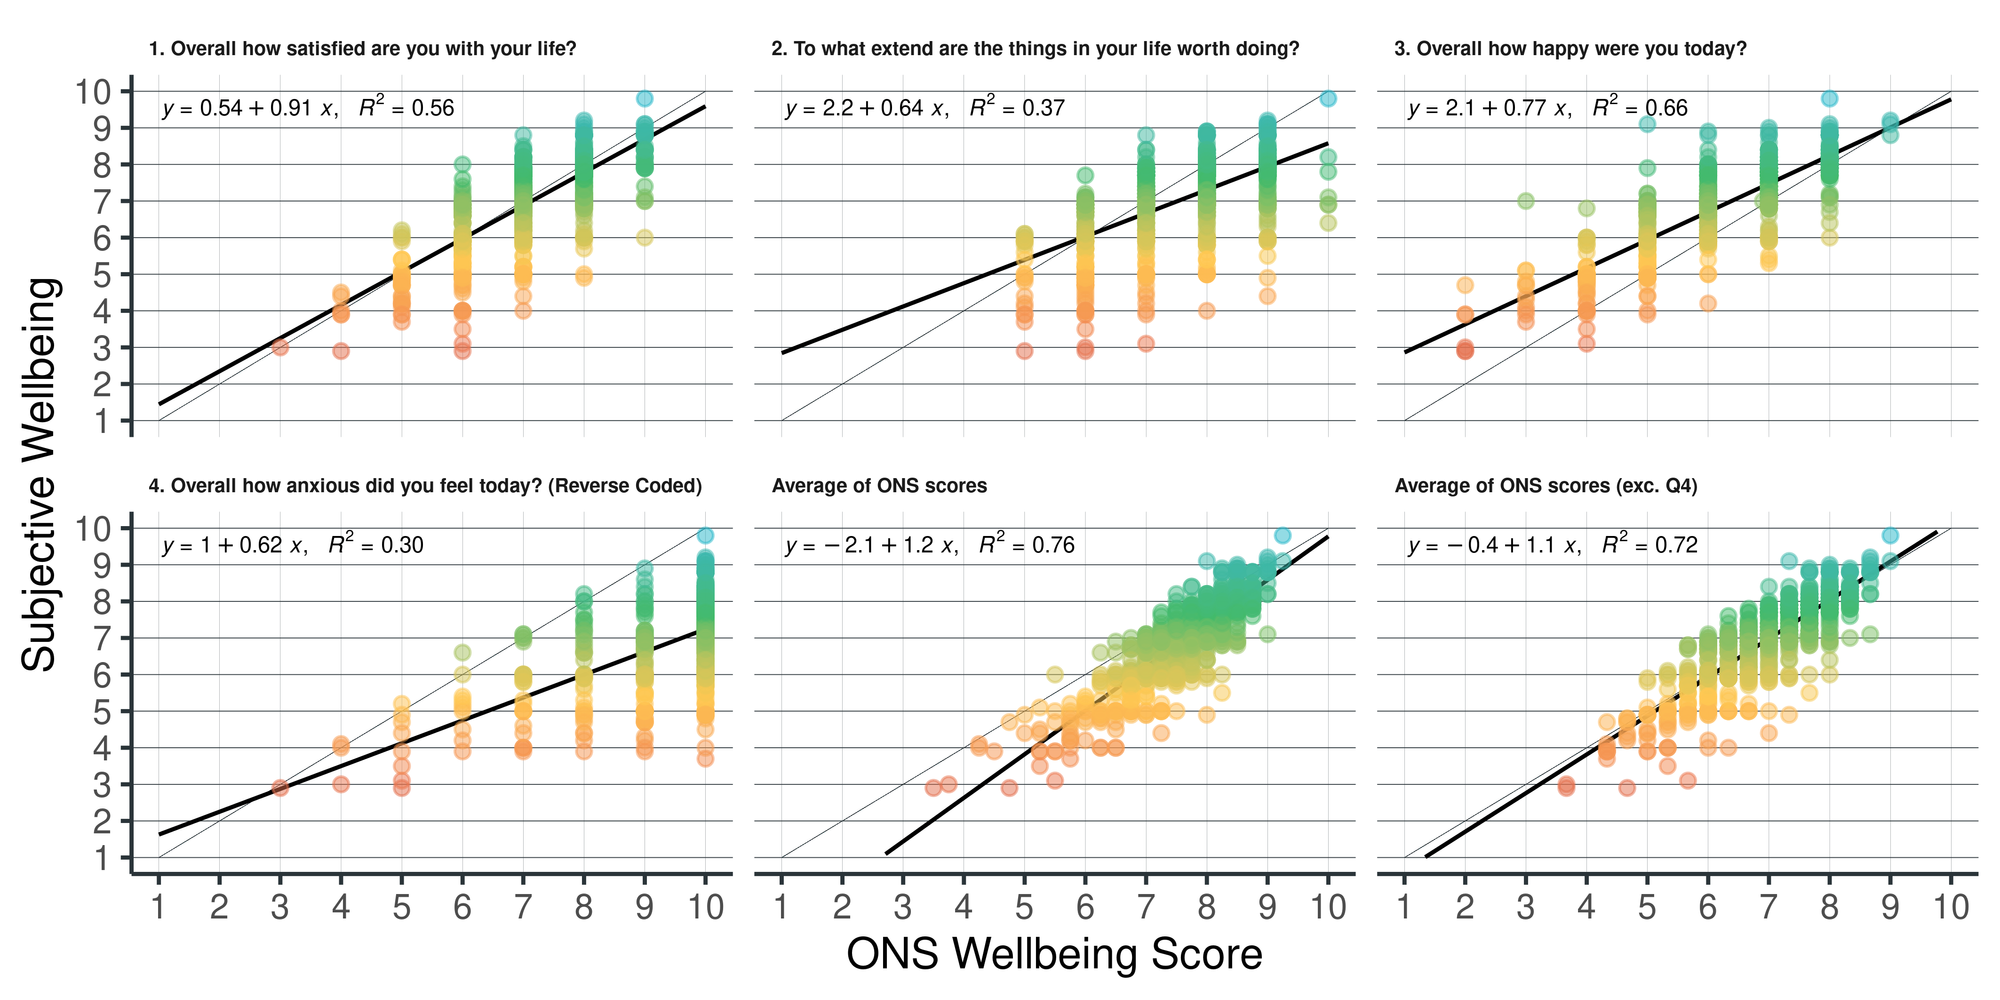
Some of the ONS questions are more correlated with my subjective wellbeing than others. This seems to be because ONS Q1 and Q2 address whether my life is 'objectively' good. Even when I felt subjectively bad I recognised that my life was objectively very fortunate, which led to a divergence between the ONS and my subjective rating. We see that ONS Q3 and Q4, which are more subjective, align more closely with my subjective wellbeing scores.
I have misinterpreted the anxiety item
I also seem to have a miscalibrated response on ONS Q4. My responses to Q4 (reverse scored) cluster tightly around 10 (for days I felt no anxiety) while lower scores (representing greater anxiety) are rare. Q4 is not normally distributed like the others, the further from 10 the rarer the score. This may be because when I answer Q4 I asked myself if I'd had an anxiety attack that day. If I did, then it gets a 9 and I go lower from there based on how severe it was. Other people might answer this question differently. An anxiety attack for them is probably a 5 while anything from 6-10 is varying degrees of worry or concern.
Notwithstanding my miscalibrated sense of anxiety, I've found the ONS questions very useful. I'll keep using them. I might start answering the ONS with scores up to one decimal place like for subjective wellbeing, but that will make data entry a hassle.